Blog / Running Data
Average Running Pace by Age and Gender: Complete Data Chart (2026)
Comprehensive tables of average mile times, 5K, 10K, half marathon, and full marathon finish times for every age group — so you know exactly where you stand
The Direct Answer
The average running pace for an adult male is 9:03 per mile. For an adult female it is 10:21 per mile. These figures represent median road race finishers across all adult age groups. Pace declines roughly 1% per year after age 35, and men run approximately 10-15% faster than women at equivalent training levels.
Use the tables below to find the average for your specific age group and gender, then compare to your own times.
What Is the Average Mile Time by Age and Gender?
The table below shows average mile times for recreational runners derived from 5K road race data. These are not world records or elite times — they represent what a typical trained recreational runner in each age bracket runs.
| Age Group | Avg Mile (Men) | Avg Mile (Women) | Men 5K | Women 5K |
|---|---|---|---|---|
| 20–24 | 7:52 | 9:17 | 24:26 | 28:52 |
| 25–29 | 8:10 | 9:29 | 25:24 | 29:31 |
| 30–34 | 8:28 | 9:45 | 26:19 | 30:19 |
| 35–39 | 8:42 | 10:03 | 27:05 | 31:15 |
| 40–44 | 9:02 | 10:21 | 28:07 | 32:13 |
| 45–49 | 9:27 | 10:47 | 29:24 | 33:31 |
| 50–54 | 9:57 | 11:22 | 30:57 | 35:22 |
| 55–59 | 10:33 | 12:04 | 32:50 | 37:32 |
| 60–64 | 11:19 | 12:58 | 35:12 | 40:18 |
| 65–69 | 12:08 | 13:57 | 37:43 | 43:22 |
| 70+ | 13:20 | 15:12 | 41:29 | 47:16 |
Source: Aggregate analysis of RunRepeat finish data, USATF road race statistics, and large U.S. road race results databases. Times reflect median finishers in recreational road races.
How to use this table
Find your age group row. If your mile time is faster than the average listed, you are running above average for your age and gender. Use the Running Pace Calculator to convert between pace, distance, and finish time.
What Is the Average 10K Time by Age and Gender?
10K race data provides a more stable performance picture than 5K because the longer distance smooths out pacing variations. These averages come from large U.S. road 10K events with broad participation across all age groups.
| Age Group | Men Avg Pace | Men Finish Time | Women Avg Pace | Women Finish Time |
|---|---|---|---|---|
| 20–24 | 8:00/mi | 49:39 | 9:30/mi | 59:00 |
| 25–29 | 8:18/mi | 51:33 | 9:44/mi | 1:00:28 |
| 30–34 | 8:35/mi | 53:14 | 10:02/mi | 1:02:18 |
| 35–39 | 8:49/mi | 54:45 | 10:21/mi | 1:04:13 |
| 40–44 | 9:10/mi | 56:53 | 10:42/mi | 1:06:26 |
| 45–49 | 9:37/mi | 59:42 | 11:07/mi | 1:09:02 |
| 50–54 | 10:08/mi | 1:02:54 | 11:43/mi | 1:12:44 |
| 55–59 | 10:44/mi | 1:06:41 | 12:24/mi | 1:16:58 |
| 60–64 | 11:28/mi | 1:11:13 | 13:16/mi | 1:22:21 |
| 65–69 | 12:17/mi | 1:16:18 | 14:15/mi | 1:28:26 |
| 70+ | 13:32/mi | 1:24:02 | 15:39/mi | 1:37:09 |
What Is the Average Half Marathon Time by Age and Gender?
The half marathon (13.1 miles) is the fastest-growing race distance in the U.S. These averages reflect data from major U.S. half marathons including the NYC Half, Rock 'n' Roll series, and broad finish-line databases aggregated by race analytics firms.
| Age Group | Men Pace/Mile | Men Finish | Women Pace/Mile | Women Finish |
|---|---|---|---|---|
| 20–24 | 8:46/mi | 1:54:49 | 10:05/mi | 2:12:04 |
| 25–29 | 8:55/mi | 1:57:00 | 10:16/mi | 2:14:26 |
| 30–34 | 9:10/mi | 2:00:12 | 10:33/mi | 2:18:09 |
| 35–39 | 9:21/mi | 2:02:37 | 10:53/mi | 2:22:35 |
| 40–44 | 9:39/mi | 2:06:42 | 11:16/mi | 2:27:37 |
| 45–49 | 10:03/mi | 2:11:47 | 11:44/mi | 2:33:54 |
| 50–54 | 10:33/mi | 2:18:22 | 12:18/mi | 2:41:05 |
| 55–59 | 11:12/mi | 2:26:44 | 13:01/mi | 2:50:27 |
| 60–64 | 11:57/mi | 2:36:28 | 13:54/mi | 3:02:21 |
| 65–69 | 12:49/mi | 2:47:48 | 14:55/mi | 3:15:22 |
| 70+ | 14:02/mi | 3:03:45 | 16:23/mi | 3:34:35 |
What Is the Average Marathon Time by Age and Gender?
Marathon finish time data comes from aggregated results across major U.S. marathons. The overall median marathon finish time is 4:32:49 for men and 4:58:33 for women. Age plays a significant role: peak marathon performance typically occurs between ages 25-34.
| Age Group | Men Pace/Mile | Men Finish | Women Pace/Mile | Women Finish |
|---|---|---|---|---|
| 20–24 | 9:45/mi | 4:15:30 | 10:46/mi | 4:42:14 |
| 25–29 | 9:50/mi | 4:17:47 | 10:51/mi | 4:44:07 |
| 30–34 | 10:00/mi | 4:21:49 | 11:01/mi | 4:48:26 |
| 35–39 | 10:17/mi | 4:29:18 | 11:22/mi | 4:57:11 |
| 40–44 | 10:28/mi | 4:34:03 | 11:37/mi | 5:03:52 |
| 45–49 | 10:48/mi | 4:42:42 | 12:04/mi | 5:15:44 |
| 50–54 | 11:16/mi | 4:55:04 | 12:37/mi | 5:30:08 |
| 55–59 | 11:55/mi | 5:11:57 | 13:21/mi | 5:49:15 |
| 60–64 | 12:47/mi | 5:34:46 | 14:16/mi | 6:13:22 |
| 65–69 | 13:43/mi | 5:59:01 | 15:22/mi | 6:42:32 |
| 70+ | 14:59/mi | 6:32:22 | 17:02/mi | 7:26:11 |
What Is a Good Running Pace for My Age?
A "good" pace is relative to age and training background. Here is a practical breakdown of pace tiers for recreational runners.
| Performance Tier | Men Mile Pace (Age 35-44) | Women Mile Pace (Age 35-44) | What It Means |
|---|---|---|---|
| Elite | Under 5:30/mi | Under 6:20/mi | Top 1% — competitive masters athlete |
| Excellent | 5:30–7:00/mi | 6:20–8:00/mi | Top 10% — serious recreational runner |
| Good | 7:00–8:30/mi | 8:00–9:45/mi | Top 25% — well-trained recreational |
| Average | 8:30–10:30/mi | 9:45–11:30/mi | Middle 50% — consistent recreational |
| Below Average | 10:30–13:00/mi | 11:30–14:00/mi | Bottom 25% — newer or inconsistent runner |
| Beginner | 13:00+/mi | 14:00+/mi | Bottom 10% — just starting out |
Tip: Use Age-Graded Performance
For the most accurate comparison across age groups, use our Age-Graded Calculator. An age-graded score above 60% is considered competitive; above 70% is excellent; above 80% is world-class for your age group.
How Much Does Running Pace Decline With Age?
Based on longitudinal race data, running performance declines at a predictable rate. Here is the expected annual pace decline by decade.
| Age Decade | Annual Pace Decline | Cumulative Effect Per Decade | Primary Cause |
|---|---|---|---|
| 20s–30s | ~0.5% / year | ~5% slower | Minor VO2 max decline, lifestyle changes |
| 30s–40s | ~0.8% / year | ~8% slower | VO2 max decline, slower recovery |
| 40s–50s | ~1.0% / year | ~10% slower | Muscle mass loss, reduced stride length |
| 50s–60s | ~1.5% / year | ~15% slower | Significant VO2 max and lactate threshold drop |
| 60s–70s | ~2.0% / year | ~20% slower | Significant muscle loss, reduced neuromuscular efficiency |
Well-trained masters runners who maintain high training volume experience slower decline — often 0.5-0.7% per year through their 50s. Resistance training and speed work are the most effective tools to slow age-related pace decline.
Frequently Asked Questions
What is the average running pace for a 40-year-old?
The average running pace for a 40-44 year old male is approximately 9:02 per mile. For women in the same age group, the average is around 10:21 per mile. These figures represent median road race finishers, not elite or beginner performance.
What is a good mile time by age?
A good mile time varies by age. For men ages 20-24, running a mile under 7:30 is good. For men 40-44, under 8:30 is considered above average. For women ages 20-24, under 9:00 is good. For women 40-44, under 9:45 is a solid performance that places you in the top 25% for your age group.
Does running pace decline with age?
Yes, but the decline is gradual. Most runners maintain their best times into their mid-30s, then experience roughly a 1% decline per year through their 40s and 50s. After 60, the decline accelerates to about 1.5-2% per year. Consistent training, strength work, and speed workouts are proven ways to slow this decline.
How do I know if I have a good pace for my age?
Compare your pace to the median in the tables above. If you are faster than the listed average for your age and gender, you are above the median. For a precise ranking, use our Age-Graded Calculator, which converts your time into a percentage of the world-record pace for your exact age. A score above 50% is average; above 60% is competitive; above 70% is excellent.
What is the average marathon finish time?
The overall average marathon finish time across all adult ages is approximately 4:32 for men and 4:59 for women. For the 35-39 age group (peak participation decade), the average is 4:29 for men and 4:57 for women. The most common marathon finish time is between 4:00 and 5:00 for both genders.
Track Your Pace Accurately
A reliable GPS watch is the foundation of pace improvement. The good news: even the entry-level Forerunner 55 has the same GPS accuracy as the flagship 965 — pick based on display, battery, and features, not pace tracking.
Garmin Forerunner 55
~$199. Same GPS accuracy as flagship watches. Daily suggested workouts, recovery time advisor, race predictor — 80% of what most runners actually need.
Check AmazonCOROS PACE 3
~$229. 24-day battery, dual-frequency GPS (more accurate than single-band), lightweight 30g. Outstanding pace accuracy at half the price of premium watches.
Check AmazonGarmin Forerunner 965
~$649. Multi-band GPS (most accurate consumer GPS available), race predictor, training readiness, AMOLED display. Worth it if you train 5+ days/week and want every metric.
Check AmazonAs an Amazon Associate we earn from qualifying purchases at no extra cost to you.
Related Running Tools and Articles
Key Takeaways
- •The average recreational mile pace is 9:03/mi for men and 10:21/mi for women across all adult ages.
- •Peak running performance occurs between ages 25-34 for most recreational runners.
- •Pace declines roughly 1% per year after age 35, accelerating to ~2% per year after 60.
- •Running faster than the median for your age and gender puts you in the top 50% — a genuine athletic achievement.
- •Use the Age-Graded Calculator for the fairest comparison across different ages.
Featured at Backcountry — 15% off first order
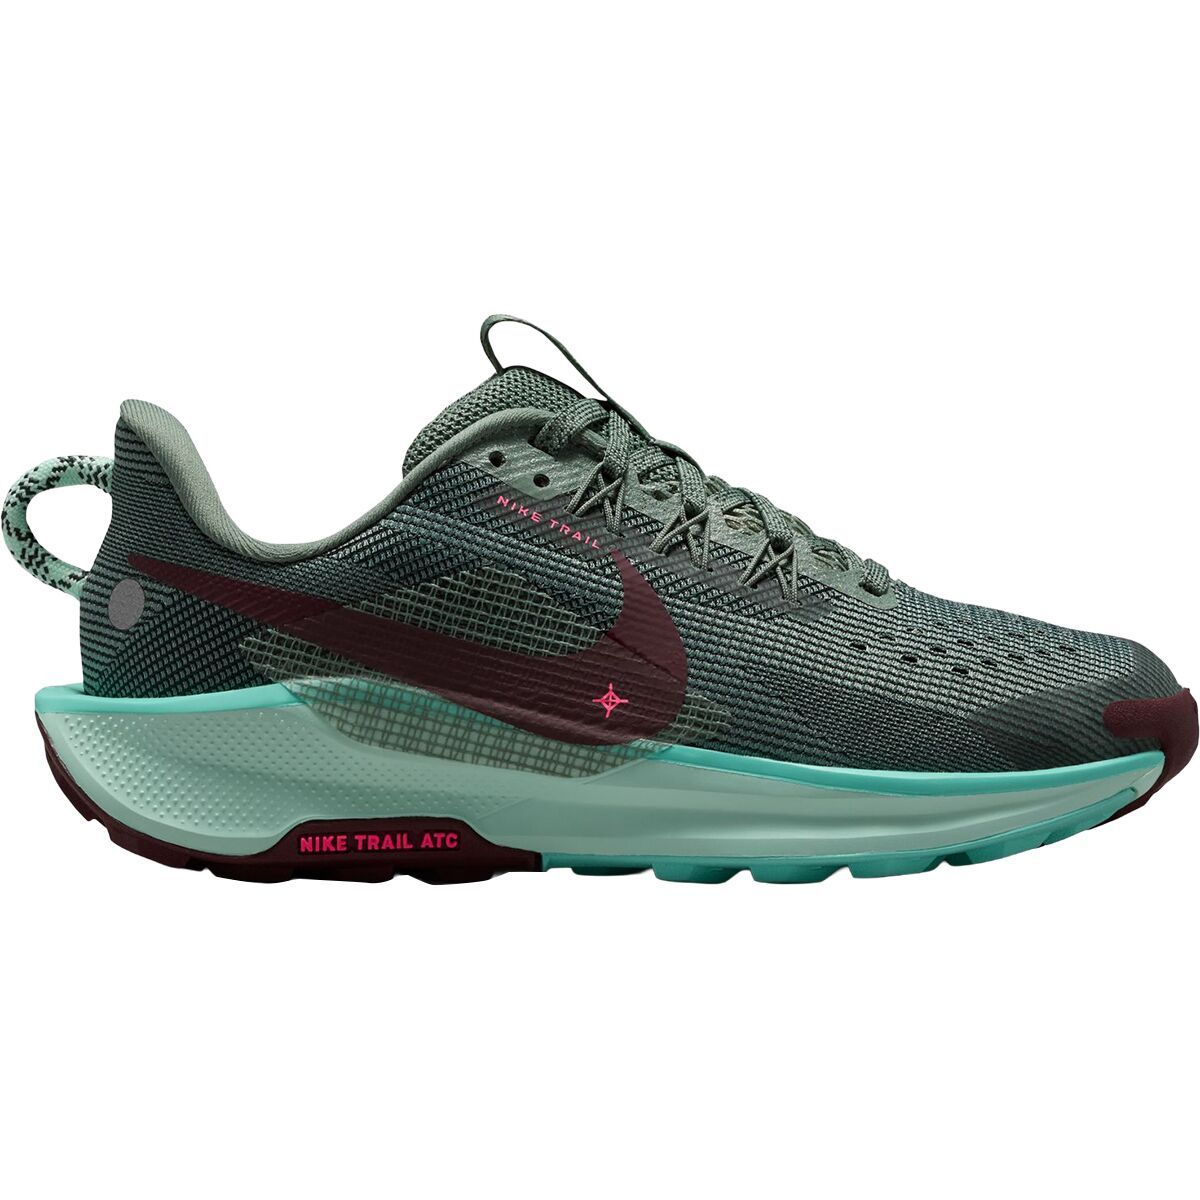
Nike Pegasus Trail 5
Our go-to trail-capable training shoe. React foam + sticky outsole.