Blog / Training Guides
How to Track Your Fitness Progress: The Complete Guide for Runners & Cyclists
The exact metrics, tools, and methods to measure real improvement — not just feel-good effort
The Short Answer
Tracking fitness progress means measuring the right metrics at regular intervals — not just how hard you feel like you're working. The most reliable indicators are pace at a consistent heart rate zone, VO2 max estimates, FTP (for cyclists), resting heart rate, and HRV trends. Pair those with weekly volume logs and body composition data for the full picture.
This guide covers every meaningful metric, how to measure each one accurately, which tools are worth buying, and how to avoid the common mistakes that make tracking feel useless.
What's In This Guide
Glen
Endurance Athlete & Gear Enthusiast
Marathoner, cyclist, and triathlete with 10+ years of experience. I've used every major tracking platform, worn every major GPS watch, and learned the hard way which metrics actually predict race performance — and which ones just create anxiety.
1. Key Fitness Metrics Worth Tracking
Most athletes track the wrong things. They obsess over total calories burned, daily step counts, and arbitrary streak numbers — and miss the metrics that actually tell you whether you're getting fitter. Here are the metrics that matter for runners and cyclists.
VO2 Max
VO2 max is the maximum volume of oxygen your body can use per minute per kilogram of body weight. It's the single best predictor of endurance performance capacity. A higher VO2 max means your body can deliver and use more oxygen during hard efforts.
What's a good VO2 max?
- Average untrained adult male: 35-40 mL/kg/min
- Recreational runner/cyclist: 45-55 mL/kg/min
- Competitive age-group athlete: 55-65 mL/kg/min
- Elite endurance athlete: 70-85+ mL/kg/min
Most GPS watches now estimate VO2 max from heart rate and pace data. These estimates are directionally useful — they show trends over time — but are less accurate than lab testing. Use estimated VO2 max to track month-to-month direction, not as an absolute benchmark.
Calculate Your VO2 Max →Resting Heart Rate (RHR)
Resting heart rate is one of the simplest and most reliable fitness indicators available. As aerobic fitness improves, your heart becomes more efficient and pumps more blood per beat — so it doesn't need to beat as often at rest. Tracking RHR over months reveals a clear downward trend as you get fitter.
Measure it first thing in the morning before getting out of bed, ideally with a chest strap or smartwatch. A week-over-week elevation of 5-10 bpm above your baseline often signals illness, overtraining, or poor recovery.
Pace at Heart Rate Zones
This is the most actionable metric for everyday training progress. As your aerobic fitness improves, you'll run faster at the same heart rate — or maintain the same pace at a lower heart rate. Neither requires a formal test. Just look at how your pace-per-mile at 140 bpm (Zone 2) changes over 8-12 weeks.
Run the same route under similar conditions every 4-6 weeks and compare average pace vs. average heart rate. Consistent improvement here is proof your aerobic base is growing.
Calculate Your Heart Rate Zones →FTP — Functional Threshold Power (Cyclists)
FTP is the cycling equivalent of lactate threshold pace for runners. It's the maximum average power output you can sustain for approximately one hour — the gold standard for measuring cycling fitness. FTP tests every 6-8 weeks show whether your training is translating to real power gains.
The standard test: ride all-out for 20 minutes and multiply your average watts by 0.95. Alternatively, use a ramp test protocol (common in apps like Zwift and TrainerRoad). Track FTP in absolute watts AND watts per kilogram — the latter matters most for climbing performance.
Calculate Your FTP →Body Composition
Scale weight alone is a poor proxy for fitness progress. A runner who adds muscle while losing fat may see no change on the scale while dramatically improving performance. Track body fat percentage and lean mass — not just total weight — for a complete picture.
Bioelectrical impedance scales (like the Withings Body+) provide daily body composition estimates with enough consistency to track trends over weeks. They're not lab-accurate, but month-to-month trends are meaningful. For serious athletes, a DEXA scan every 6 months provides the most accurate body composition data available.
Weekly Training Volume
Total weekly mileage (running) or hours/TSS (cycling) shows whether you're building the load your body needs to adapt. Volume is the foundation. Without consistent training load, no metric will improve.
Track four-week rolling averages rather than week-to-week numbers. This smooths out the inevitable skipped day or cut-short week and shows your true training trend. The 10% weekly volume increase guideline is conservative but useful as a ceiling to avoid injury spikes.
Sleep Quality and HRV
Heart Rate Variability (HRV) and sleep quality are recovery metrics — they tell you whether your body is ready to absorb more training stress or needs to back off. HRV is measured as the variation in milliseconds between consecutive heartbeats. A higher, stable HRV indicates good parasympathetic nervous system activity and recovery.
Track HRV trends over weeks rather than reacting to daily fluctuations. A sustained HRV decline over 5-7 days is a warning sign to reduce intensity. Devices like the Whoop 4.0 and Garmin watches with overnight HRV tracking make this passive and automatic.
Read: The Complete Guide to HRV Training →2. How to Measure Each Metric
Knowing which metrics to track is only half the equation. Here's exactly how to measure each one accurately without a sports science lab.
| Metric | How to Measure | Frequency | Tool Needed |
|---|---|---|---|
| VO2 Max | GPS watch estimate or Cooper 12-min test | Every 6-8 weeks | GPS watch or calculator |
| Resting HR | Before getting up in morning | Daily (rolling avg) | Watch or chest strap |
| Pace at HR Zone | Same route, same HR target, record pace | Every 4-6 weeks | GPS watch + HR monitor |
| FTP | 20-min all-out effort × 0.95, or ramp test | Every 6-8 weeks | Power meter or smart trainer |
| Body Composition | Smart scale, same time of day, fasted | Weekly (trending) | Body composition scale |
| Weekly Volume | Sum of miles/hours each week | Weekly + 4-week rolling avg | Training log or GPS watch |
| HRV | Overnight auto-measurement via wearable | Daily (7-day trend) | Whoop, Garmin, or HR strap app |
Use RunBikeCalc's Free Progress Tracker
Our built-in progress tracker lets you log key metrics over time and see trend charts for pace, heart rate, and fitness scores — all in one place, no account required.
Open Progress Tracker →Measuring VO2 Max Without a Lab
You have three practical options for estimating VO2 max without a sports lab:
- GPS watch estimation: Garmin, Polar, and Apple Watch all estimate VO2 max from heart rate and pace/power data. These are convenient but can be 5-10% off from lab values. Use them for trend tracking, not absolute comparisons.
- The Cooper 12-Minute Test: Run as far as possible in 12 minutes on a flat surface. Use our VO2 max calculator to convert the distance to an estimated VO2 max. Retest every 6-8 weeks under the same conditions.
- Submaximal HR test: Run at a fixed, easy pace for 15-20 minutes and record your average heart rate. As fitness improves, your heart rate at that same pace will drop over time.
The Aerobic Decoupling Method
Aerobic decoupling compares your heart rate in the first half of a long run to the second half at the same pace. If heart rate climbs significantly in the second half (above 5% decoupling), your aerobic base needs more work. This is a sophisticated indicator available in Garmin Connect and Training Peaks that most athletes overlook.
For deeper analysis on how VO2 max improvements unfold over a training cycle, read our guide on realistic VO2 max improvement timelines.
3. Best Tools for Fitness Progress Tracking
You don't need to spend a fortune to track fitness effectively. Here are the tools that deliver the most actionable data, from the essential to the advanced.
Garmin Forerunner 265
GPS Running & Cycling Watch with Training Readiness
~$400
The Forerunner 265 is the best all-around fitness tracking watch for runners and cyclists who want serious data without going pro. It tracks estimated VO2 max, training load, training readiness, HRV status, body battery, pace at heart rate, and more. The AMOLED display makes data readable mid-run without squinting, and GPS accuracy is excellent.
From a fitness progress tracking standpoint, the Forerunner 265 gives you a 4-week training load chart, training status (productive/peaking/overreaching), recovery time estimates, and VO2 max trends — all automatically, just by wearing it during workouts.
Key tracking features:
- Estimated VO2 max (running and cycling)
- HRV Status — nightly overnight tracking
- Training Readiness score (0-100)
- Training Load & Load Focus (aerobic/anaerobic)
- Body Battery energy monitoring
- Acute/Chronic load ratio tracking
Also see: Best Running Watches 2026 and Best GPS Watches Under $200
Polar H10 Chest Strap
Clinical-Grade Heart Rate Monitoring
~$80
If you're serious about heart rate-based training, wrist optical HR sensors are not good enough. They can be off by 10-15 bpm during high-intensity intervals, which will corrupt your zone data. The Polar H10 chest strap delivers ECG-accurate heart rate data — the gold standard for zone training and HRV measurement.
Paired with any ANT+ or Bluetooth GPS watch (or even your phone), the H10 gives you the accurate HR data needed to make pace-at-HR comparisons meaningful. It also works with HRV apps like Elite HRV and HRV4Training for morning readiness checks.
Why chest strap beats optical:
- Accurate during intervals and threshold efforts
- No lag during heart rate changes
- Works in cold weather when wrist sensors fail
- Enables accurate HRV measurement with dedicated apps
Also see: Best Heart Rate Monitors 2026
Withings Body+ Smart Scale
Body Weight, Fat, Muscle Mass & More
~$100
The Withings Body+ tracks weight, body fat percentage, muscle mass, bone mass, and water percentage using bioelectrical impedance. It connects to the Withings Health Mate app, which shows long-term trend charts — essential for seeing how your body composition changes during training blocks.
For athletes, the most useful feature is watching lean mass increase and fat mass decrease simultaneously, which can be invisible on a regular scale. It also syncs with Garmin, Apple Health, and Google Fit for an integrated fitness dashboard.
Best practices for accurate readings:
- Weigh at the same time each day — ideally morning, fasted
- Track the 7-day rolling average, not daily readings
- Don't weigh within 2 hours of hard exercise (fluid shifts)
- Pregnancy, implanted devices, and extreme dehydration reduce accuracy
Whoop 4.0
Continuous HRV, Recovery, and Strain Tracking
~$30/mo
(device included)
Whoop takes a different approach to fitness tracking — it's entirely focused on recovery and readiness rather than workout metrics. Every morning you get a Recovery Score (0-100%) based on overnight HRV, resting heart rate, sleep performance, and respiratory rate. This score tells you whether today is a day to push hard or dial back.
For athletes who want to understand the relationship between training load and recovery, Whoop provides the clearest picture available. It's the preferred device among serious athletes who want to avoid overtraining and optimize the balance between stress and recovery. The tradeoff: it requires a subscription rather than a one-time purchase.
What Whoop tracks for progress:
- Overnight HRV (milliseconds) — trend over months
- Resting heart rate trends
- Sleep staging and sleep performance %
- Daily Strain score (training load)
- Recovery Score — readiness to train
Also see: Best Fitness Trackers 2026
Training Journal / Notebook
Analog Logging for Patterns and Subjective Feel
~$15
Don't underestimate the value of a physical training log. Apps capture objective data beautifully, but they miss subjective signals: how your legs felt, whether that headache showed up in mile 8, how stress at work correlated with your worst training week of the year. A paper training log captures what no algorithm can.
After years of training, I still keep a short daily log alongside my Garmin data. Each entry takes 3 minutes and includes: session summary, perceived effort, how I felt (1-10), one observation, and planned next session. Monthly reviews of this log reveal patterns that pure data never would.
What to log in each session:
Distance/duration, pace or power, average HR, perceived effort (RPE 1-10), how you felt (legs/lungs/mood), weather conditions, notable observations, and sleep hours the prior night.
4. Setting Realistic Goals and Improvement Timelines
One of the biggest frustrations in fitness tracking is expecting improvements that don't match the timeline reality of human physiology. Here's what's actually realistic for each fitness level.
Beginner (0-6 months)
New athletes see the fastest improvements because they're starting from a low baseline. Adaptation comes quickly.
- VO2 max: +3-8 mL/kg/min in first 3 months
- Resting HR: Drop of 5-15 bpm in 8-12 weeks
- Pace at Zone 2: 30-60 sec/mile faster in 8 weeks
- Visible metric changes: After 4-6 weeks
Intermediate (6 months–3 yrs)
Progress slows considerably. Improvements require more structured, intentional training rather than just adding volume.
- VO2 max: +1-3 mL/kg/min per training block
- FTP (cycling): +5-15 watts per 8-week block
- Pace at Zone 2: 10-20 sec/mile over 12 weeks
- Visible metric changes: After 8-10 weeks
Advanced (3+ years)
Marginal gains require precise periodization, recovery optimization, and often coaching. Improvements are meaningful but come slowly.
- VO2 max: +0.5-1 mL/kg/min per year
- FTP (cycling): +3-8 watts per block
- Pace at Zone 2: 5-10 sec/mile over 16 weeks
- Visible metric changes: After 12-16 weeks
The Most Underrated Goal-Setting Rule
Set process goals alongside outcome goals. "Run 40 miles per week for 12 consecutive weeks" is more controllable and predictive of improvement than "run a 3:30 marathon." Consistent process produces consistent results. Track your adherence to the process, not just the outcome metrics.
For a detailed breakdown of how VO2 max improvements unfold across training phases, read our complete VO2 max improvement timeline guide. For HRV-guided training periodization, see the HRV training complete guide.
5. Common Fitness Tracking Mistakes to Avoid
After years of training and years of talking to other athletes, these are the tracking mistakes I see most often — and the ones that cause the most frustration.
1. Tracking Too Many Metrics
Choosing 10 metrics creates analysis paralysis. Pick 3-4 core metrics that align with your primary goal and track those consistently. For aerobic development: resting HR, pace at Zone 2, weekly volume, and sleep quality. For cycling fitness: FTP, watts/kg, weekly TSS, and HRV trend. More data is not better data.
2. Ignoring Subjective Feel
Objective data has blind spots. Devices don't know whether you're stressed at work, fighting a cold, or running on 5 hours of sleep. Rating your perceived effort (RPE 1-10) alongside objective data creates context that makes your metrics interpretable. An 8:00/mile run at RPE 4 tells a completely different story than the same pace at RPE 8.
3. Comparing Your Metrics to Others
VO2 max varies enormously based on genetics, age, sex, altitude, and training history. An advanced 50-year-old woman with a VO2 max of 48 may be a far better-trained athlete than a sedentary 25-year-old man with a VO2 max of 52. The only meaningful comparison is your own data over time. Track your progress relative to yourself.
4. Reacting to Day-to-Day Fluctuations
HRV can drop 20% from one day to the next due to a single glass of wine, a stressful meeting, or mild dehydration. Resting HR shifts 3-5 bpm based on ambient temperature. Daily numbers are noisy. Always assess the 7-day or 28-day trend, not the last data point. Reacting to daily fluctuations leads to erratic training and unnecessary anxiety.
5. Testing Too Frequently
Doing an FTP test every two weeks will not make you fitter. Testing has a physiological cost (it's a hard effort), and doing it too often actually takes away training time and creates psychological pressure. Test at the end of each training block — every 6-8 weeks is right for most athletes. Resist the urge to retest when you think you might get a better number.
6. Mistaking Fitness for Freshness
During a high-volume training block, your performance metrics will often decline temporarily — this is normal and expected. Athletes who panic and reduce training when their FTP drops 3 watts mid-block are mistaking accumulated fatigue for fitness regression. The supercompensation (real fitness gain) happens after the recovery taper, not during the hard block. Trust the process.
6. Free Fitness Tracking Tools on RunBikeCalc
You don't need a premium platform subscription to do serious fitness tracking. These free tools give you everything you need to measure, calculate, and monitor your progress.
Fitness Progress Tracker
Log runs, rides, and key metrics over time. See trend charts for pace, HR, and fitness scores.
Open Tracker →VO2 Max Calculator
Estimate your VO2 max from race times or the Cooper 12-minute test. Track changes over training blocks.
Calculate →Heart Rate Zone Calculator
Calculate your 5 training zones by max HR or LTHR. Essential for accurate zone-based tracking.
Calculate →FTP Calculator
Convert your 20-minute test result to FTP. Track watts per kilogram over training cycles.
Calculate →Frequently Asked Questions
How do I track my fitness progress as a runner?
The most reliable methods: monitor your pace at a consistent heart rate over time, test your VO2 max or Cooper Test result every 6-8 weeks, log weekly mileage, and record resting heart rate each morning. A GPS watch paired with a chest strap heart rate monitor gives you the data to see real trends across weeks and months. Our free progress tracker lets you log and chart all of these in one place.
What is the best metric to measure fitness improvement?
For runners, pace at a given heart rate zone is one of the most reliable and actionable indicators — as you get fitter, you run faster at the same effort level. For cyclists, FTP (watts per kilogram) is the gold standard. VO2 max improvements are meaningful long-term markers, but harder to measure accurately without lab testing or consistent field-test conditions.
How often should I test my fitness?
Formal fitness tests every 6-8 weeks is sufficient for most recreational athletes. Testing too frequently introduces noise and disrupts training continuity. Track day-to-day metrics like resting HR, HRV, and sleep quality passively through a wearable, and reserve structured tests like an FTP test or time trial for end-of-training-block assessments.
What is HRV and why does it matter for fitness tracking?
Heart Rate Variability (HRV) is the variation in time between consecutive heartbeats. A higher, stable HRV generally indicates better recovery and readiness to train hard. Tracking HRV daily — especially first thing in the morning — helps you identify accumulated fatigue before it becomes overtraining. Read our complete HRV training guide for full detail on measuring and applying HRV data.
How long does it take to see fitness improvements from running?
Most beginners notice measurable aerobic improvements within 4-6 weeks of consistent training. Intermediate runners typically need 8-12 weeks of focused training to see significant metric changes. VO2 max improvements plateau faster than muscular adaptations — experienced athletes may need 16-24 weeks of structured training to move the needle meaningfully.
Is VO2 max a good way to track fitness progress?
VO2 max is a useful benchmark but has limitations as a day-to-day tracking metric. Estimated VO2 max from GPS watches can fluctuate based on conditions, fatigue, and GPS accuracy. Use our VO2 max calculator to estimate your score from field tests, and track the number every 6-8 weeks rather than every workout.
What is FTP and how do I use it to track cycling fitness?
Functional Threshold Power (FTP) is the maximum average power you can sustain for approximately one hour. It's typically tested via a 20-minute all-out effort (multiply result by 0.95) or a ramp test. Retesting every 6-8 weeks lets you track absolute power gains and watts-per-kilogram improvements. Use our FTP calculator to convert test results and calculate your training zones.
Do I need expensive gear to track fitness progress?
No. A simple training journal and basic running watch cover the fundamentals: distance, pace, perceived effort, and weekly volume. A chest strap heart rate monitor (~$80, like the Polar H10) adds meaningful physiological data. The free tools on RunBikeCalc — including the VO2 max calculator, heart rate zone calculator, and FTP calculator — let you do sophisticated analysis without any subscription fees.
The Bottom Line
Tracking fitness progress is about creating a system that shows you objective evidence of improvement — and gives you early warning when something is wrong. Start with three or four core metrics, measure them consistently, and compare trend lines over weeks and months rather than day to day.
For most runners, the essential setup is: a GPS watch with built-in HR for passive tracking, a chest strap for accurate zone training (the Polar H10 at ~$80 is worth every dollar), and a simple log — digital or paper — for subjective notes. Add a body composition scale and a recovery monitor like Whoop when you're ready to go deeper.
The goal isn't perfect data — it's enough data to make better training decisions. Use the RunBikeCalc Progress Tracker as your central hub, pair it with our calculators for VO2 max, heart rate zones, and FTP, and you have a complete fitness tracking system that costs nothing and takes five minutes per week to maintain.
Start Tracking Your Progress Today
Free tools, no account required. See your fitness trend in minutes.
Open the Progress Tracker →Featured at Backcountry — 15% off first order
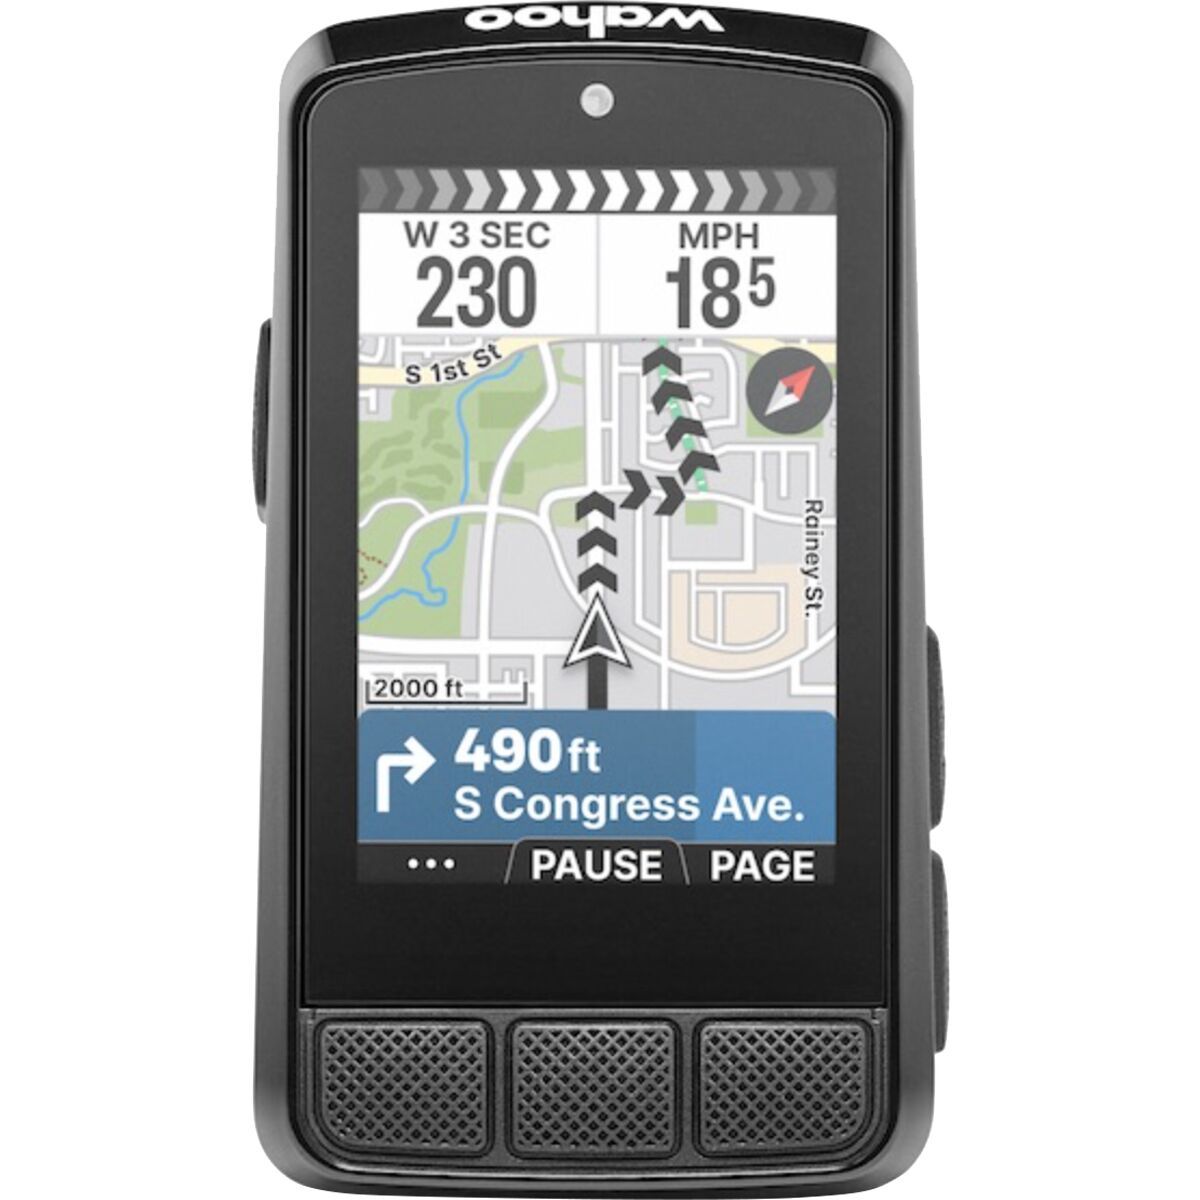
Wahoo ELEMNT BOLT 3
Track your rides with Wahoo's compact GPS — the bike computer we use daily.