
Understanding Race Pace Relationships: 5K to Marathon Conversion Factors
You just ran a 22-minute 5K. What marathon time does that suggest? How much slower should your 10K pace be? What training paces should you target? This comprehensive guide explains the mathematical relationships between race distances, provides 20+ worked examples, and shows you how to apply these conversions to your training and racing.
Predict Your Race Times Instantly
Enter any recent race result to predict times at other distances with our free calculator.
Race Time Predictor CalculatorQuick Reference: What You'll Learn
- The Riegel formula and how it works
- Common conversion factors between distances
- 20+ worked pace calculation examples
- Environmental adjustment factors
- Gender-specific considerations
- Age-graded pace adjustments
- Training paces from race times
- Common mistakes to avoid
The Science Behind Pace Relationships
The Riegel Formula Explained
Most race time predictors use a formula developed by researcher Peter Riegel in 1977:
Where:
- T1 = Your known race time
- D1 = The distance of that race
- D2 = The distance you want to predict
- 1.06 = The fatigue exponent
The exponent (1.06) represents the slowing effect of longer distances. As distance increases, pace slows due to fatigue, glycogen depletion, accumulated muscle damage, and psychological stress. This single number encapsulates decades of research into human endurance limits.
Why 1.06? The Physiology of Fatigue
The 1.06 exponent isn't arbitrary. It reflects several physiological realities:
- Glycogen depletion: Muscle glycogen stores typically last 90-120 minutes at race intensity
- Lactate accumulation: Even at sub-threshold paces, lactate slowly builds over hours
- Muscle damage: Repetitive impact causes progressive fiber damage
- Central fatigue: The brain gradually reduces motor unit recruitment
- Thermal stress: Core temperature rises throughout extended efforts
Common Conversion Factors
These multiplication factors allow quick estimation without complex calculations:
| From | To | Multiply Time By | Typical Pace Slowdown |
|---|---|---|---|
| 5K | 10K | 2.09 | +5-10 sec/mile |
| 5K | 15K | 3.25 | +12-18 sec/mile |
| 5K | Half Marathon | 4.65 | +20-35 sec/mile |
| 5K | Marathon | 9.8 | +45-75 sec/mile |
| 10K | Half Marathon | 2.22 | +15-25 sec/mile |
| 10K | Marathon | 4.65 | +35-55 sec/mile |
| Half Marathon | Marathon | 2.1 | +15-30 sec/mile |
Worked Examples: 20+ Pace Calculations
Let's work through detailed examples at different fitness levels to illustrate these relationships.
Example Set 1: Elite Runner (18:00 5K)
Starting Point: 18:00 5K (5:48/mile pace)
- 10K: 18:00 x 2.09 = 37:37 (6:04/mile) - 16 sec/mile slower
- 15K: 18:00 x 3.25 = 58:30 (6:16/mile) - 28 sec/mile slower
- Half Marathon: 18:00 x 4.65 = 1:23:42 (6:24/mile) - 36 sec/mile slower
- Marathon: 18:00 x 9.8 = 2:56:24 (6:44/mile) - 56 sec/mile slower
Example Set 2: Sub-20 Runner (19:30 5K)
Starting Point: 19:30 5K (6:17/mile pace)
- 10K: 19:30 x 2.09 = 40:45 (6:34/mile) - 17 sec/mile slower
- 15K: 19:30 x 3.25 = 63:23 (6:48/mile) - 31 sec/mile slower
- Half Marathon: 19:30 x 4.65 = 1:30:41 (6:56/mile) - 39 sec/mile slower
- Marathon: 19:30 x 9.8 = 3:11:06 (7:17/mile) - 60 sec/mile slower
Example Set 3: Competitive Club Runner (22:00 5K)
Starting Point: 22:00 5K (7:05/mile pace)
- 10K: 22:00 x 2.09 = 45:59 (7:24/mile) - 19 sec/mile slower
- 15K: 22:00 x 3.25 = 71:30 (7:40/mile) - 35 sec/mile slower
- Half Marathon: 22:00 x 4.65 = 1:42:18 (7:50/mile) - 45 sec/mile slower
- Marathon: 22:00 x 9.8 = 3:35:36 (8:13/mile) - 68 sec/mile slower
Example Set 4: Recreational Runner (25:00 5K)
Starting Point: 25:00 5K (8:03/mile pace)
- 10K: 25:00 x 2.09 = 52:15 (8:25/mile) - 22 sec/mile slower
- 15K: 25:00 x 3.25 = 81:15 (8:43/mile) - 40 sec/mile slower
- Half Marathon: 25:00 x 4.65 = 1:56:15 (8:53/mile) - 50 sec/mile slower
- Marathon: 25:00 x 9.8 = 4:05:00 (9:21/mile) - 78 sec/mile slower
Example Set 5: Beginning Runner (30:00 5K)
Starting Point: 30:00 5K (9:39/mile pace)
- 10K: 30:00 x 2.09 = 62:42 (10:06/mile) - 27 sec/mile slower
- 15K: 30:00 x 3.25 = 97:30 (10:28/mile) - 49 sec/mile slower
- Half Marathon: 30:00 x 4.65 = 2:19:30 (10:40/mile) - 61 sec/mile slower
- Marathon: 30:00 x 9.8 = 4:54:00 (11:13/mile) - 94 sec/mile slower
Pace Equivalency Tables by Fitness Level
These tables show equivalent performances across distances. If you can run one time, you should theoretically be capable of the others (with appropriate training).
Elite/Sub-Elite Runners
| 5K | 10K | Half Marathon | Marathon |
|---|---|---|---|
| 14:00 | 29:16 | 1:05:06 | 2:17:12 |
| 15:00 | 31:21 | 1:09:45 | 2:27:00 |
| 16:00 | 33:26 | 1:14:24 | 2:36:48 |
| 17:00 | 35:32 | 1:19:03 | 2:46:36 |
| 18:00 | 37:37 | 1:23:42 | 2:56:24 |
Competitive Recreational Runners
| 5K | 10K | Half Marathon | Marathon |
|---|---|---|---|
| 19:00 | 39:43 | 1:28:21 | 3:06:12 |
| 20:00 | 41:48 | 1:33:00 | 3:16:00 |
| 21:00 | 43:53 | 1:37:39 | 3:25:48 |
| 22:00 | 45:59 | 1:42:18 | 3:35:36 |
| 23:00 | 48:04 | 1:46:57 | 3:45:24 |
| 24:00 | 50:10 | 1:51:36 | 3:55:12 |
Recreational Runners
| 5K | 10K | Half Marathon | Marathon |
|---|---|---|---|
| 25:00 | 52:15 | 1:56:15 | 4:05:00 |
| 26:00 | 54:21 | 2:00:54 | 4:14:48 |
| 27:00 | 56:26 | 2:05:33 | 4:24:36 |
| 28:00 | 58:31 | 2:10:12 | 4:34:24 |
| 29:00 | 1:00:37 | 2:14:51 | 4:44:12 |
| 30:00 | 1:02:42 | 2:19:30 | 4:54:00 |
Beginning Runners
| 5K | 10K | Half Marathon | Marathon |
|---|---|---|---|
| 32:00 | 1:06:53 | 2:28:48 | 5:13:36 |
| 35:00 | 1:13:09 | 2:42:45 | 5:43:00 |
| 38:00 | 1:19:26 | 2:56:42 | 6:12:24 |
| 40:00 | 1:23:36 | 3:06:00 | 6:32:00 |
Calculate Your Training Paces
Convert any race result into specific training zone paces for easy, tempo, threshold, and interval workouts.
Running Pace CalculatorEnvironmental Adjustment Factors
Race conditions significantly impact performance. Use these adjustments to modify your predictions.
Heat Adjustment Factors
Heat impacts marathon performance far more than shorter distances because of cumulative thermal stress.
| Temperature | 5K Impact | 10K Impact | Half Marathon | Marathon |
|---|---|---|---|---|
| 50-59F (10-15C) | Optimal | Optimal | Optimal | Optimal |
| 60-65F (15-18C) | +0-1% | +0-1% | +1-2% | +1-3% |
| 66-70F (19-21C) | +1-2% | +1-2% | +2-3% | +3-5% |
| 71-75F (22-24C) | +2-3% | +2-4% | +4-6% | +5-8% |
| 76-80F (24-27C) | +3-5% | +4-6% | +6-10% | +8-12% |
| 80F+ (27C+) | +5-8% | +6-10% | +10-15% | +12-20% |
Example: A 3:30 marathon runner racing at 75F should adjust to 3:40-3:47 (5-8% slower).
Altitude Adjustment Factors
Altitude reduces oxygen availability, impacting performance proportionally to effort duration.
| Altitude | 5K Impact | 10K Impact | Half Marathon | Marathon |
|---|---|---|---|---|
| Sea Level - 2,000ft | Baseline | Baseline | Baseline | Baseline |
| 3,000-4,000ft | +2-3% | +2-3% | +2-4% | +3-4% |
| 5,000-6,000ft | +3-5% | +4-5% | +4-6% | +5-7% |
| 7,000-8,000ft | +5-7% | +6-8% | +7-9% | +8-10% |
| 9,000-10,000ft | +8-10% | +9-11% | +10-12% | +11-14% |
Example: A sea-level 45:00 10K runner racing at 5,280ft (Denver) should expect 46:48-47:15 (4-5% slower).
Wind Adjustment Factors
| Wind Speed | Headwind Impact | Tailwind Benefit | Net on Out-and-Back |
|---|---|---|---|
| 5-10 mph (Light) | +2-3% | -1% | +1-2% |
| 10-15 mph (Moderate) | +4-6% | -1.5% | +2.5-4.5% |
| 15-20 mph (Strong) | +7-10% | -2% | +5-8% |
| 20+ mph (Very Strong) | +12-15% | -2.5% | +9.5-12.5% |
Note: Headwind slows you more than tailwind helps because air resistance increases with the square of velocity. A tailwind never fully compensates for a headwind of equal strength.
Course Elevation Adjustment
| Net Elevation Change | Time Adjustment | Notes |
|---|---|---|
| Net Downhill (100+ ft drop) | -1-2% | Boston Marathon qualifier adjustment |
| Flat (less than 100ft total) | Baseline | Ideal for PRs |
| Rolling (200-500ft gain) | +1-3% | Hills break rhythm |
| Hilly (500-1000ft gain) | +3-6% | Significant muscular cost |
| Mountainous (1000+ ft gain) | +6-12% | Major impact on time |
Gender-Specific Considerations
While the Riegel formula works for both men and women, research shows some interesting gender differences in endurance performance.
Women's Endurance Advantage
Studies consistently show that women demonstrate superior fatigue resistance at ultra-endurance distances:
- Pacing consistency: Women slow less in the second half of marathons (average 11% vs 15% for men)
- Fat oxidation: Women utilize fat more efficiently, sparing glycogen at marathon pace
- Muscle fiber composition: Higher proportion of slow-twitch fibers in many women
- Psychological factors: Research suggests women are less likely to start too fast
Adjusted Conversion Factors for Women
| Conversion | Standard Factor | Women's Adjusted | Difference |
|---|---|---|---|
| 5K to 10K | 2.09 | 2.08 | -0.5% |
| 5K to Half | 4.65 | 4.58 | -1.5% |
| 5K to Marathon | 9.8 | 9.5 | -3% |
| 10K to Marathon | 4.65 | 4.55 | -2% |
| Half to Marathon | 2.1 | 2.07 | -1.5% |
Example: A woman with a 23:00 5K using standard factors predicts 3:45:24 marathon. Using women's adjusted factors: 23:00 x 9.5 = 3:38:30 - nearly 7 minutes faster.
Men's Speed vs Endurance
Men typically show:
- Greater speed reserve: Higher peak velocities but less sustainable at threshold
- More aggressive pacing: Higher risk of positive splits in long races
- Faster glycogen depletion: Higher carbohydrate oxidation rates
Age-Graded Pace Adjustments
Performance naturally declines with age. These factors help adjust predictions for masters runners.
Age-Grading Factors by Decade
| Age Group | Men's Factor | Women's Factor | % Decline from Peak |
|---|---|---|---|
| 25-29 | 1.000 | 1.000 | Peak years |
| 30-34 | 0.990 | 0.992 | 1% |
| 35-39 | 0.970 | 0.975 | 2.5-3% |
| 40-44 | 0.940 | 0.950 | 5-6% |
| 45-49 | 0.905 | 0.920 | 8-9.5% |
| 50-54 | 0.865 | 0.885 | 11.5-13.5% |
| 55-59 | 0.820 | 0.845 | 15.5-18% |
| 60-64 | 0.770 | 0.800 | 20-23% |
| 65-69 | 0.715 | 0.750 | 25-28.5% |
| 70-74 | 0.655 | 0.695 | 30.5-34.5% |
Age-Graded Prediction Examples
Example: 50-year-old male with 24:00 5K
- Raw marathon prediction: 24:00 x 9.8 = 3:55:12
- Age-equivalent 5K (at age 30): 24:00 x 0.865 = 20:46
- Age-equivalent marathon: 20:46 x 9.8 = 3:23:28
- Interpretation: This 50-year-old is performing at the same relative level as a 30-year-old running 3:23:28
Masters Runners: Endurance Retention
Research shows masters runners often retain endurance better than speed:
- VO2max declines ~10% per decade after 30
- Running economy often improves with experience
- Lactate threshold can be maintained longer than peak speed
- Marathon performance declines more slowly than 5K performance
This means older runners may find predictions from shorter races slightly pessimistic for marathons. A 55-year-old's 5K may suggest a slower marathon than they can actually run.
Training Paces Derived from Race Times
Your race performances establish training zones. Here's how to derive daily training paces from your race results.
Training Pace Zones from 5K Time
| Zone | Purpose | Pace vs 5K Pace | Example (22:00 5K) |
|---|---|---|---|
| Easy/Recovery | Aerobic base, recovery | +60-90 sec/mile | 8:05-8:35/mile |
| Long Run | Endurance building | +45-75 sec/mile | 7:50-8:20/mile |
| Marathon Pace | Race-specific endurance | +50-70 sec/mile | 7:55-8:15/mile |
| Tempo/Threshold | Lactate clearance | +20-30 sec/mile | 7:25-7:35/mile |
| VO2max Intervals | Aerobic power | 5K pace or faster | 7:05/mile or faster |
| Speed/Repetitions | Neuromuscular, form | Mile pace (-20-30 sec) | 6:20-6:40/mile |
Training Pace Zones from Marathon Time
| Zone | Purpose | Pace vs Marathon Pace | Example (3:30 Marathon) |
|---|---|---|---|
| Easy/Recovery | Aerobic base | +45-75 sec/mile | 8:46-9:16/mile |
| Long Run | Endurance | +30-60 sec/mile | 8:31-9:01/mile |
| Marathon Pace | Goal race pace | Goal pace | 8:01/mile |
| Half Marathon Pace | Stamina | -15-25 sec/mile | 7:36-7:46/mile |
| Threshold | Lactate clearance | -30-45 sec/mile | 7:16-7:31/mile |
Complete Training Pace Chart
Here are training paces for common 5K times:
| 5K Time | Easy | Marathon | Tempo | VO2max |
|---|---|---|---|---|
| 18:00 | 6:50-7:20 | 6:35-6:55 | 6:05-6:15 | 5:48 |
| 20:00 | 7:30-8:00 | 7:15-7:35 | 6:40-6:50 | 6:26 |
| 22:00 | 8:05-8:35 | 7:55-8:15 | 7:25-7:35 | 7:05 |
| 24:00 | 8:45-9:15 | 8:30-8:50 | 8:00-8:10 | 7:43 |
| 26:00 | 9:25-9:55 | 9:10-9:30 | 8:35-8:45 | 8:22 |
| 28:00 | 10:00-10:30 | 9:45-10:05 | 9:10-9:20 | 9:01 |
| 30:00 | 10:40-11:10 | 10:25-10:45 | 9:50-10:00 | 9:39 |
How to Use These Relationships for Training
Building a Training Plan from Race Data
Your recent race results create a complete training framework:
Step 1: Establish Your Current Fitness
Use your most recent race (within 4-6 weeks) at any distance. Multiple races provide more accuracy.
Step 2: Calculate Equivalent Times
Use conversion factors to estimate performances at all distances. These become your benchmark for setting training paces.
Step 3: Derive Training Paces
- Easy runs: 60-90 seconds slower than 5K pace
- Long runs: At easy pace or slightly faster (marathon pace on designated workouts)
- Tempo runs: 25-30 seconds slower than 5K pace (approximately 10K-15K race pace)
- VO2max intervals: At 5K pace for 3-5 minute repetitions
- Speed work: Faster than 5K pace for shorter repetitions
Step 4: Progress Appropriately
As fitness improves, race again to recalibrate. Don't adjust paces based on how you feel - use objective race data.
Sample Training Week Based on 22:00 5K
| Day | Workout | Pace | Distance |
|---|---|---|---|
| Monday | Easy + strides | 8:15/mile | 5 miles |
| Tuesday | VO2max: 5x1000m | 7:05/mile (4:24/km) | 7 miles total |
| Wednesday | Easy | 8:20/mile | 6 miles |
| Thursday | Tempo: 4 miles | 7:30/mile | 8 miles total |
| Friday | Easy/Recovery | 8:30/mile | 4 miles |
| Saturday | Long run | 8:00-8:20/mile | 14 miles |
| Sunday | Rest or easy | - | 0-4 miles |
Real-World Race Day Application
Pre-Race: Setting Your Goal
- Use recent data: Base predictions on races from the last 4-8 weeks
- Account for conditions: Adjust for heat, altitude, wind, course profile
- Consider training: Did you complete the specific preparation for your target distance?
- Set a range: Have A, B, and C goals based on how the day unfolds
Race Execution: Pacing Strategy
5K-10K Pacing
- Start at goal pace or 2-3 seconds slower for first 800m
- Settle into goal pace through middle miles
- Reserve effort for final 1-2K push
- Acceptable to run slightly faster than predicted if feeling strong
Half Marathon Pacing
- First 3 miles: Goal pace or 5-10 seconds slower
- Miles 4-10: Lock into goal pace, stay controlled
- Miles 11-13.1: If feeling good, gradually increase effort
- Goal: Negative split or even pacing
Marathon Pacing
- Miles 1-3: 10-15 seconds SLOWER than goal pace (bank nothing)
- Miles 4-13: Settle into goal pace, monitor effort
- Miles 14-20: Maintain pace if effort is sustainable
- Miles 21-26.2: Hold steady; if you've paced correctly, you can maintain
- Critical rule: If you feel great at mile 20, you paced correctly
Post-Race: Analyzing Your Result
After racing, compare actual performance to predictions:
- Faster than predicted: Your endurance exceeds your speed; consider more speed work
- Matched prediction: Well-balanced fitness and execution
- Slower than predicted: Indicates pacing issues, insufficient training, or conditions impact
Common Mistakes to Avoid
Mistake #1: Using Old Race Data
A 5K from 6 months ago doesn't reflect current fitness. Fitness changes significantly in weeks. Use data from the last 4-8 weeks.
Mistake #2: Ignoring Training Specificity
A great 5K doesn't guarantee marathon success. You must complete marathon-specific training (long runs, marathon pace work) to achieve predicted times. Predictions assume equivalent preparation.
Mistake #3: Not Accounting for Conditions
Running a predicted 3:30 marathon pace in 80F heat leads to disaster. Always adjust for temperature, humidity, altitude, and course profile.
Mistake #4: Starting Too Fast
Feeling great in the first miles often leads to going faster than plan. This creates oxygen debt and glycogen depletion that catches up later. Trust your pacing plan.
Mistake #5: Using Only One Data Point
A single race may have been an outlier (great day, terrible day, aided course). Multiple race results provide more reliable predictions.
Mistake #6: Treating Predictions as Guarantees
Race predictors estimate potential, not certainty. They assume perfect conditions, optimal pacing, and peak fitness alignment. Use predictions as targets, not promises.
Mistake #7: Ignoring Individual Variation
Some runners are naturally better at shorter distances (speed types), others at longer distances (endurance types). Standard factors are averages - your personal ratio may differ.
Mistake #8: Not Testing Goal Pace in Training
If you've never run marathon pace for extended periods in training, race day is not the time to discover whether it's sustainable. Include goal-pace workouts in your preparation.
Plan Your Race Pacing
Use our race pace calculator to plan perfect splits for any distance.
Race Pace CalculatorAdvanced Topics
Alternative Prediction Models
While the Riegel formula is most common, other models exist:
- Cameron model: Uses different exponents based on distance pair - more accurate for specific conversions
- Purdy points: Converts times to standardized scores allowing comparison across distances
- VDOT (Daniels): Uses VO2max equivalent to predict times and set training paces
- McMillan: Applies adjustment factors for training status and race experience
When Predictions Break Down
Standard formulas become less accurate in these situations:
- Ultra distances: Beyond marathon, additional factors (nutrition, sleep, mental fatigue) dominate
- Extreme specialization: A track 5K specialist may significantly underperform at marathon
- First-time at distance: Experience at a distance matters - predictions improve with repetition
- Major fitness changes: During rapid improvement phases, predictions from old times lag actual fitness
Creating Your Personal Conversion Factors
After racing multiple distances, calculate your personal conversion ratios:
- Divide longer race time by shorter race time (e.g., marathon time / 5K time)
- Compare to standard factors (9.8 for 5K to marathon)
- If your ratio is higher, you're a speed type (5K is relative strength)
- If your ratio is lower, you're an endurance type (marathon is relative strength)
- Use your personal ratio for future predictions
Featured at Backcountry — 15% off first order
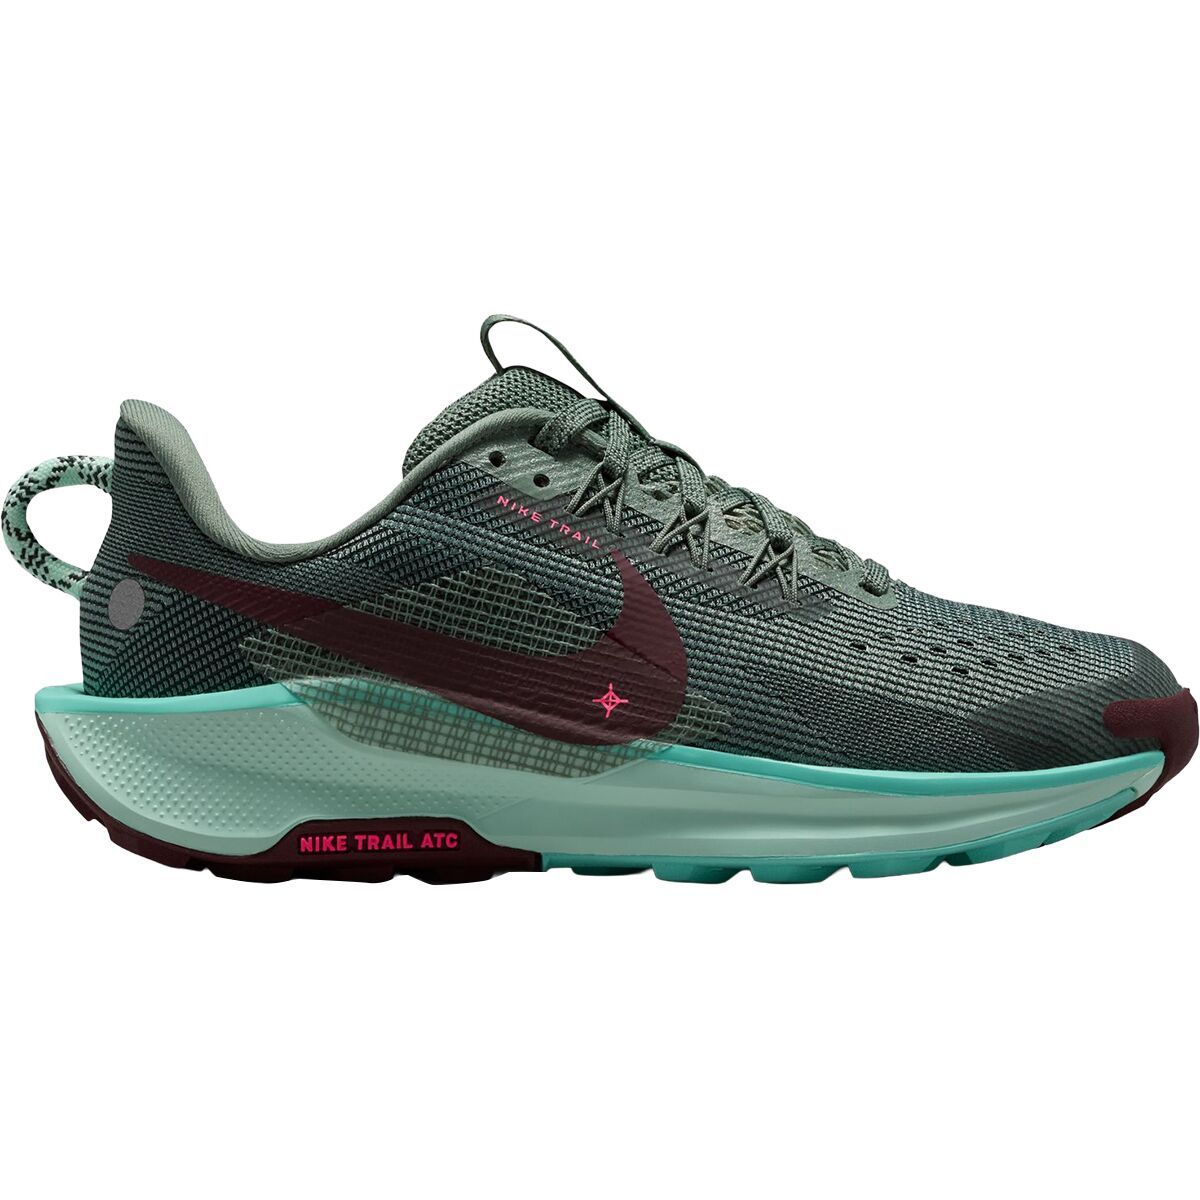
Nike Pegasus Trail 5
Our go-to trail-capable training shoe. React foam + sticky outsole.